Projects
Technical Projects
Hi! Here you can find some of my technical projects. I enjoy exploring different ways to visualize data and computer vision applications.
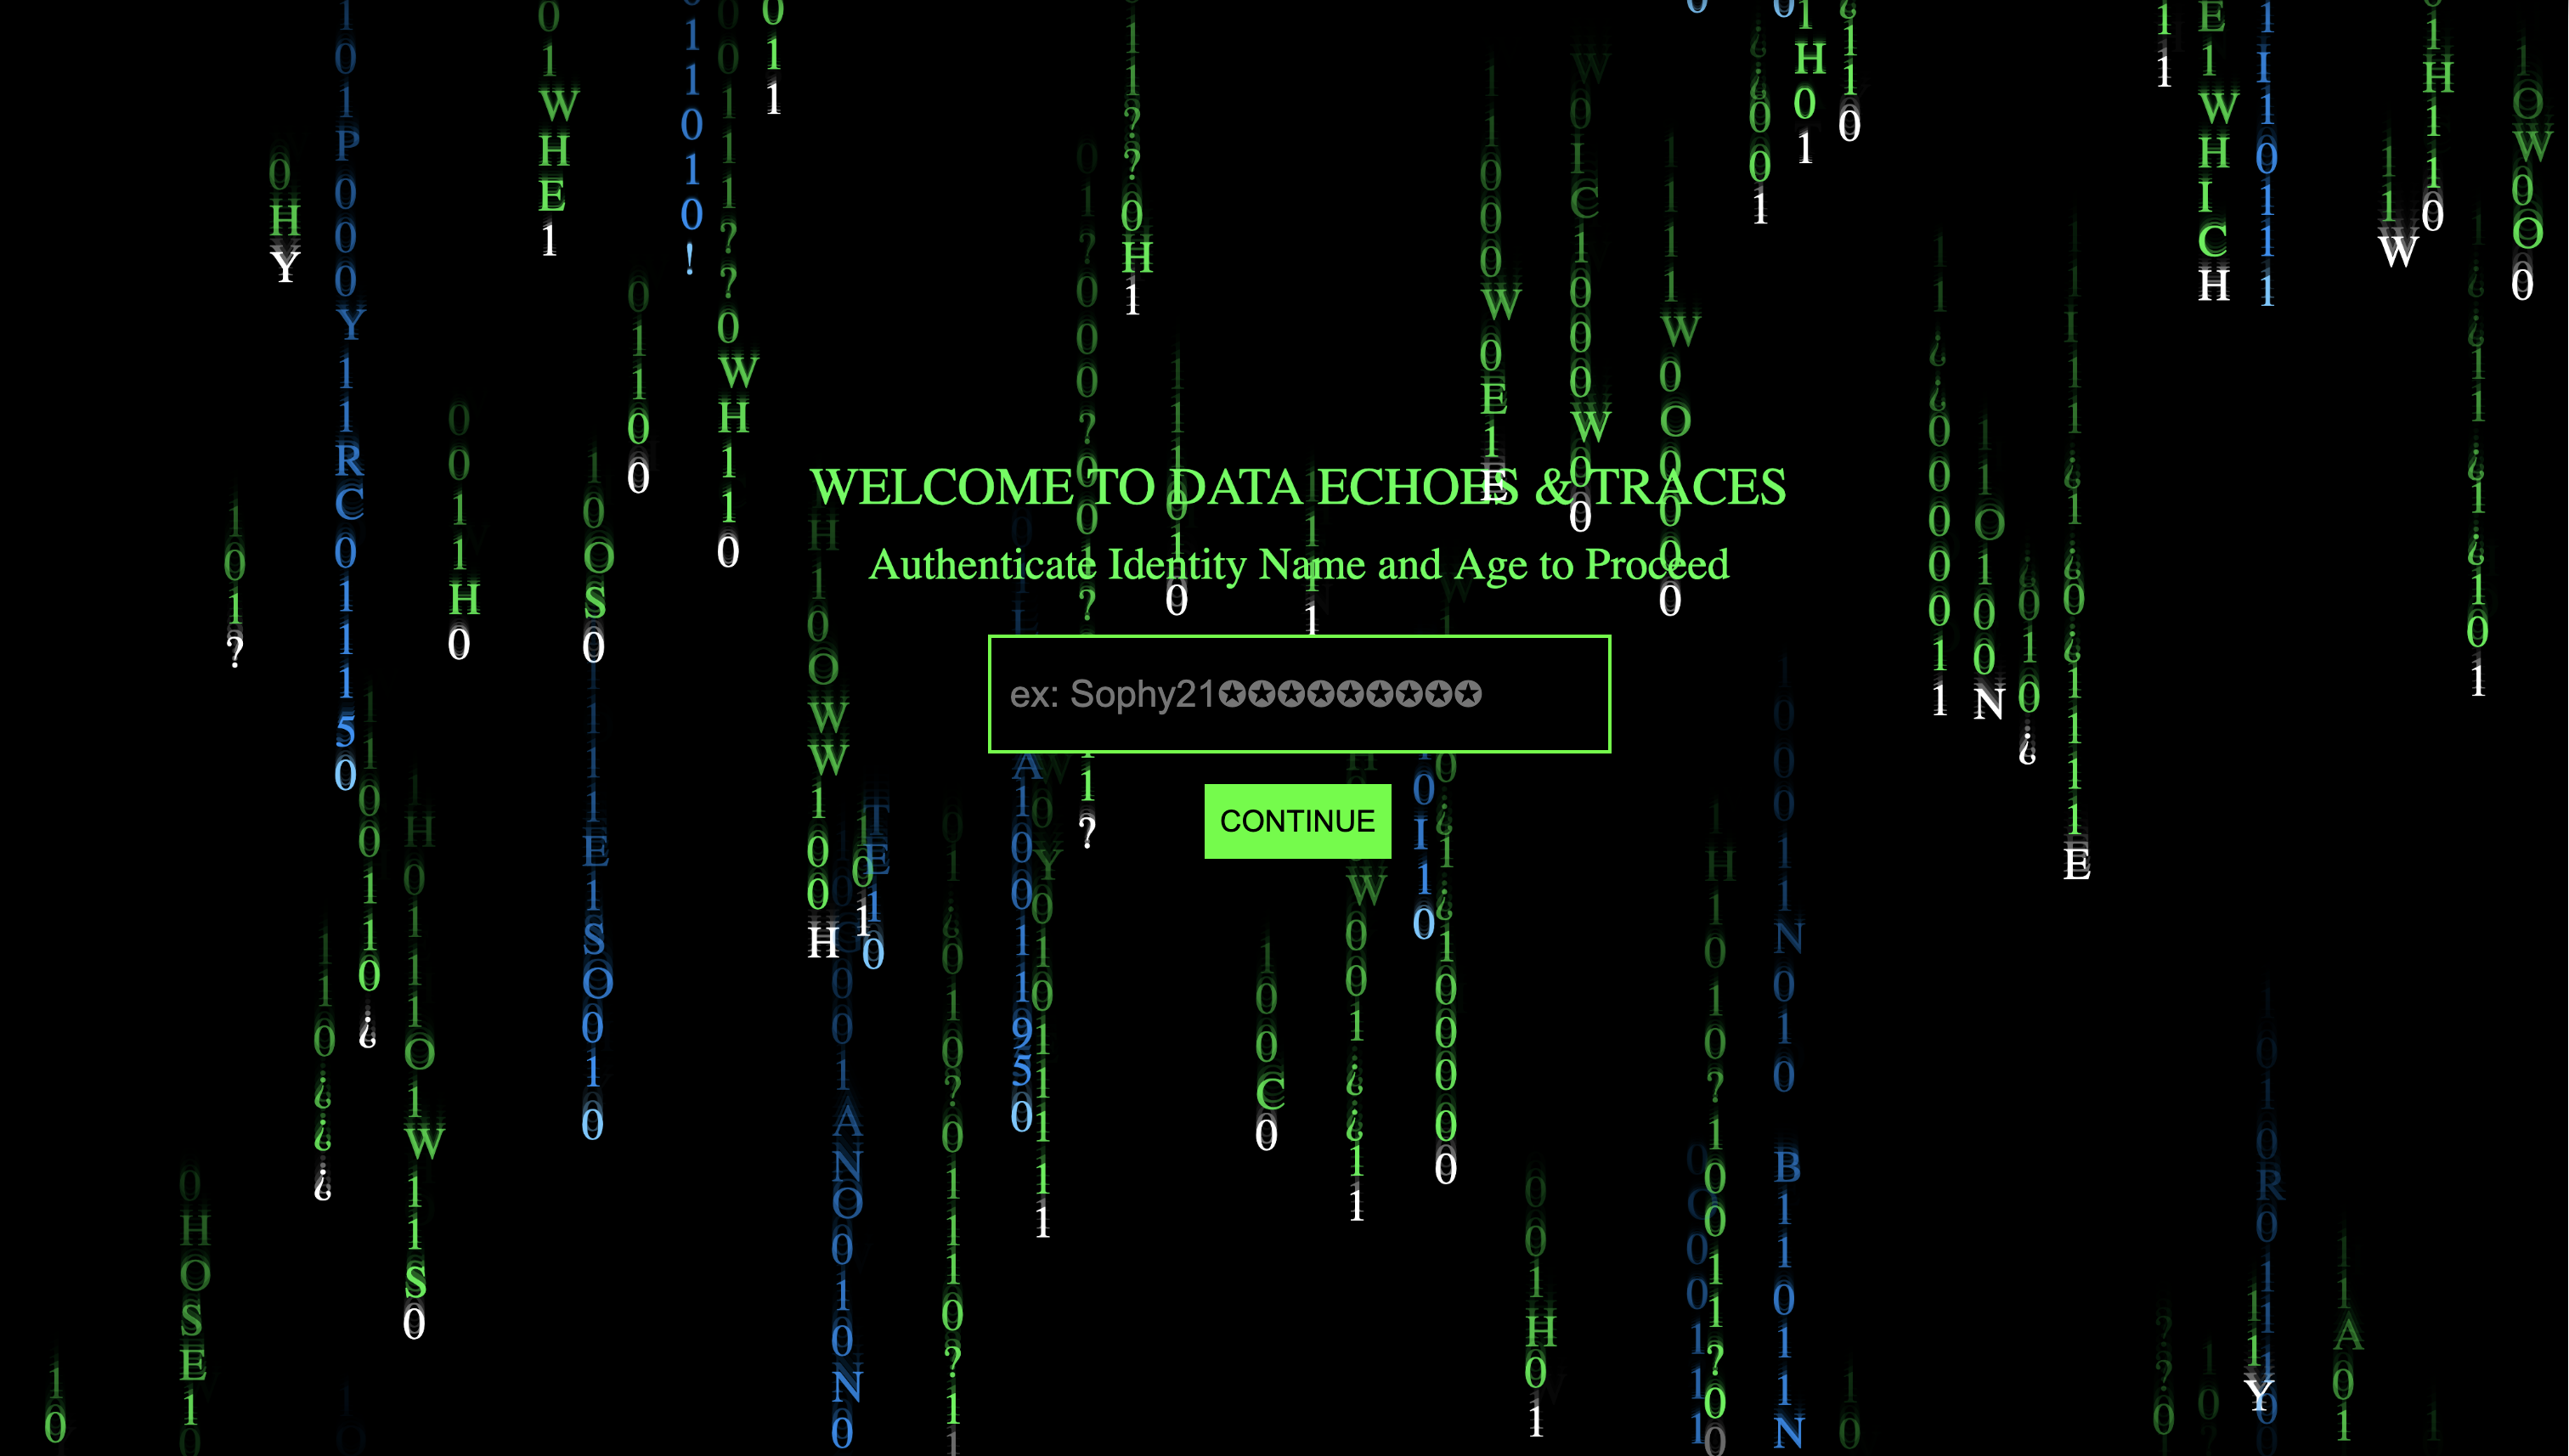
ᯅ Data Echoes & Traces: Interactive Installation & WebVR Game
An immersive VR art installation exploring data embodiment and digital surveillance through persistent data architecture. Built with A-Frame and Supabase, the installation captures every user interaction—text inputs, voice recordings, movement patterns, and game responses—as permanent "data echoes" stored in a cloud database. Each session retrieves and displays historical data from previous visitors, creating an evolving archive that visualizes how digital traces accumulate over time. Features a Matrix-inspired digital rain login (p5.js), multi-realm VR cyberspace with AI vs. authentic content challenges, and custom A-Frame components including VR keyboard input and Web Audio API integration. Senior exercise project for Computer Science and Media Studies, currently in development.
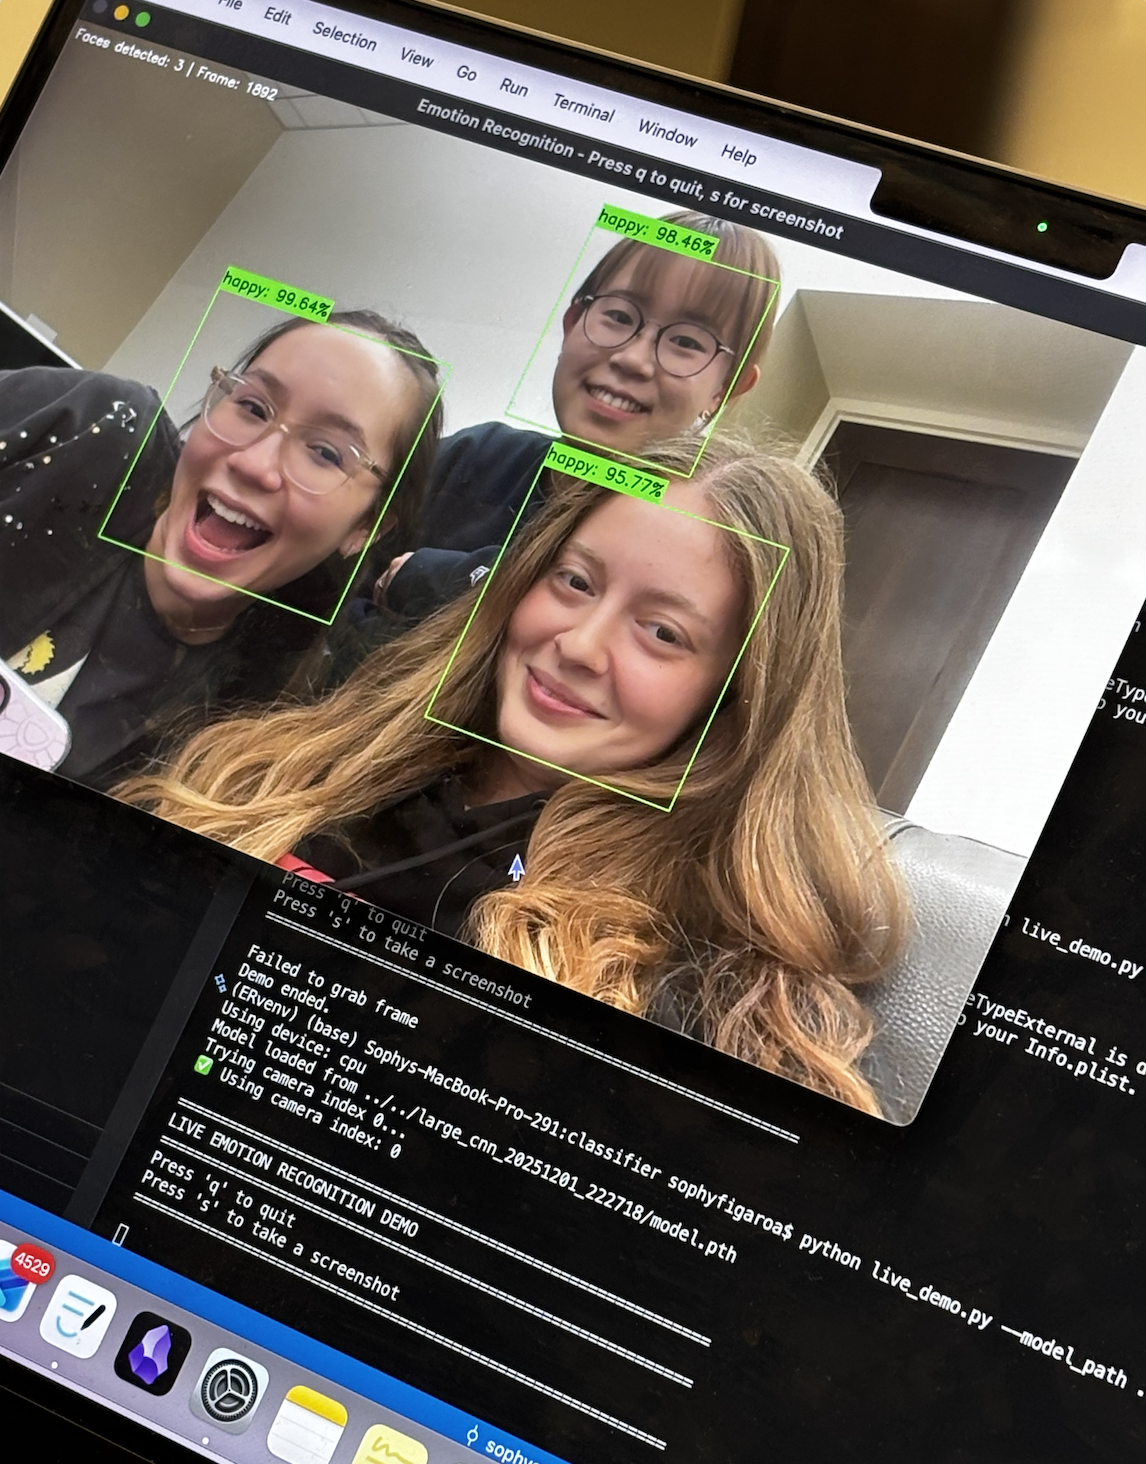
🎭 Real-Time Facial Emotion Recognition
A deep learning system that classifies seven emotions (angry, disgust, fear, happy, neutral, sad, surprise) from facial expressions using convolutional neural networks. Built and compared three CNN architectures, achieving 69% training accuracy and 60% validation accuracy on 49,779 grayscale images from the FER2013 dataset. Features include data augmentation, batch normalization, dropout regularization, and a live webcam demo interface for real-time emotion detection.
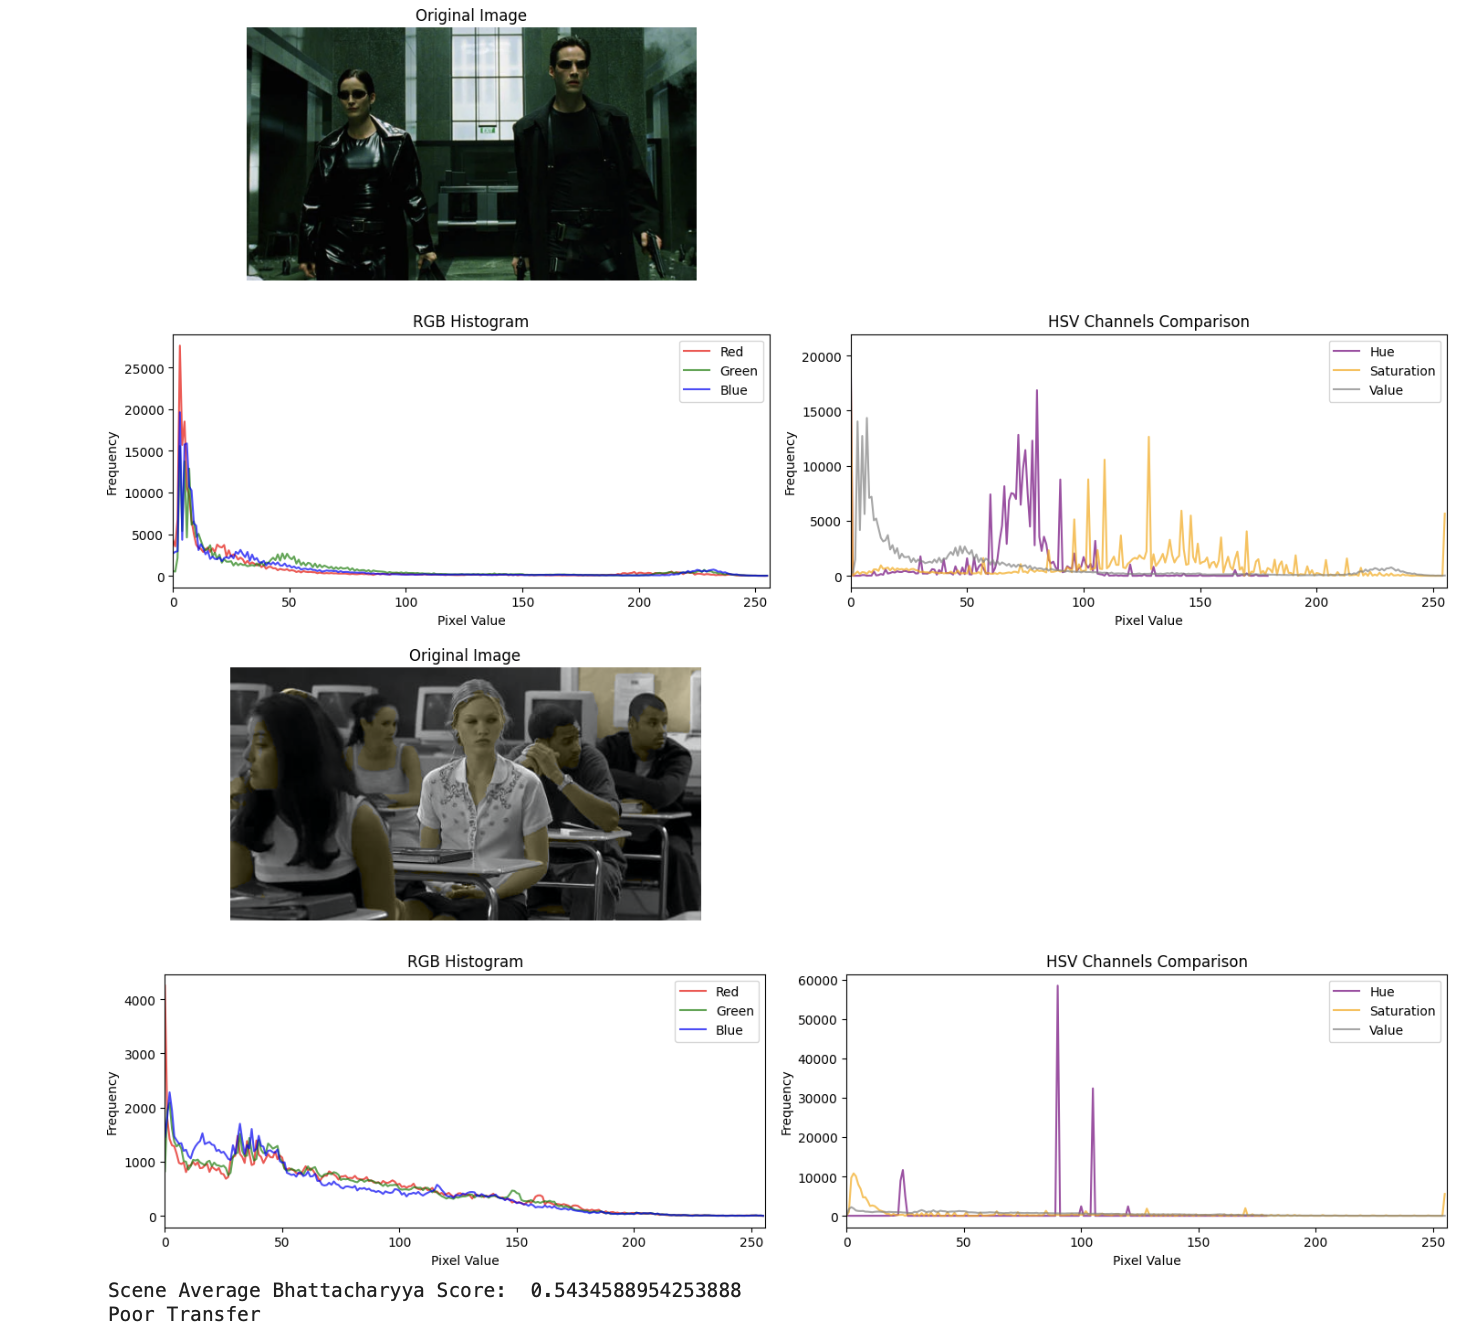
🎬 Color Transfer Between Movie Scenes
Automated color transfer between film scenes using a cluster-based framework and five palette matching strategies. Transforms the color style of one scene to resemble another (e.g., The Matrix, La La Land, Harry Potter) while preserving scene semantics.
- Five color transfer algorithms:
- Relative distance-based mapping
- Target frequency (many-to-one and one-to-one)
- Source frequency (one-to-one)
- Depth-based transfer using monocular depth estimation
- Preprocessing with CIELAB color space and brightness filtering
- Quantitative evaluation using RGB and HSV histograms with Bhattacharyya distance
- Visual comparison for qualitative assessment
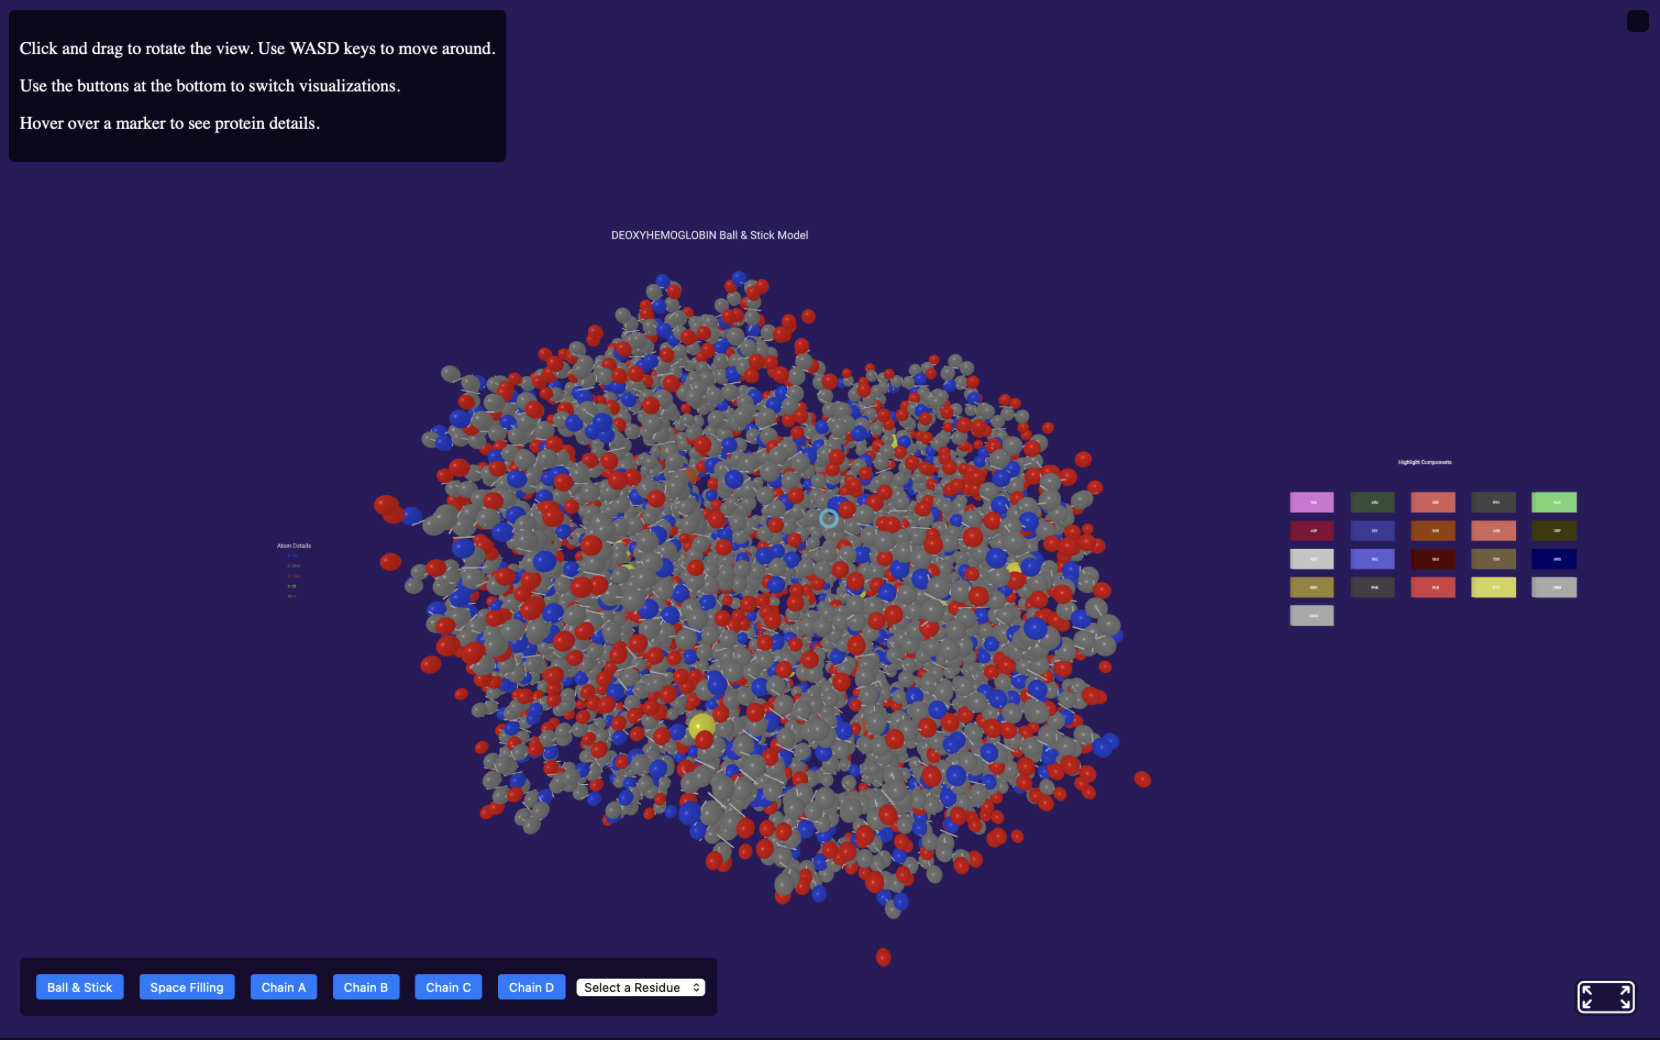
🧬 Immersive VR Protein Visualization
An interactive 3D/VR visualization of the deoxyhemoglobin protein structure (PDB ID: 1A3N) developed using A-Frame. Features multiple view styles including ribbon and ball-and-stick models, with component and chain selection to display individual chains and subunits.
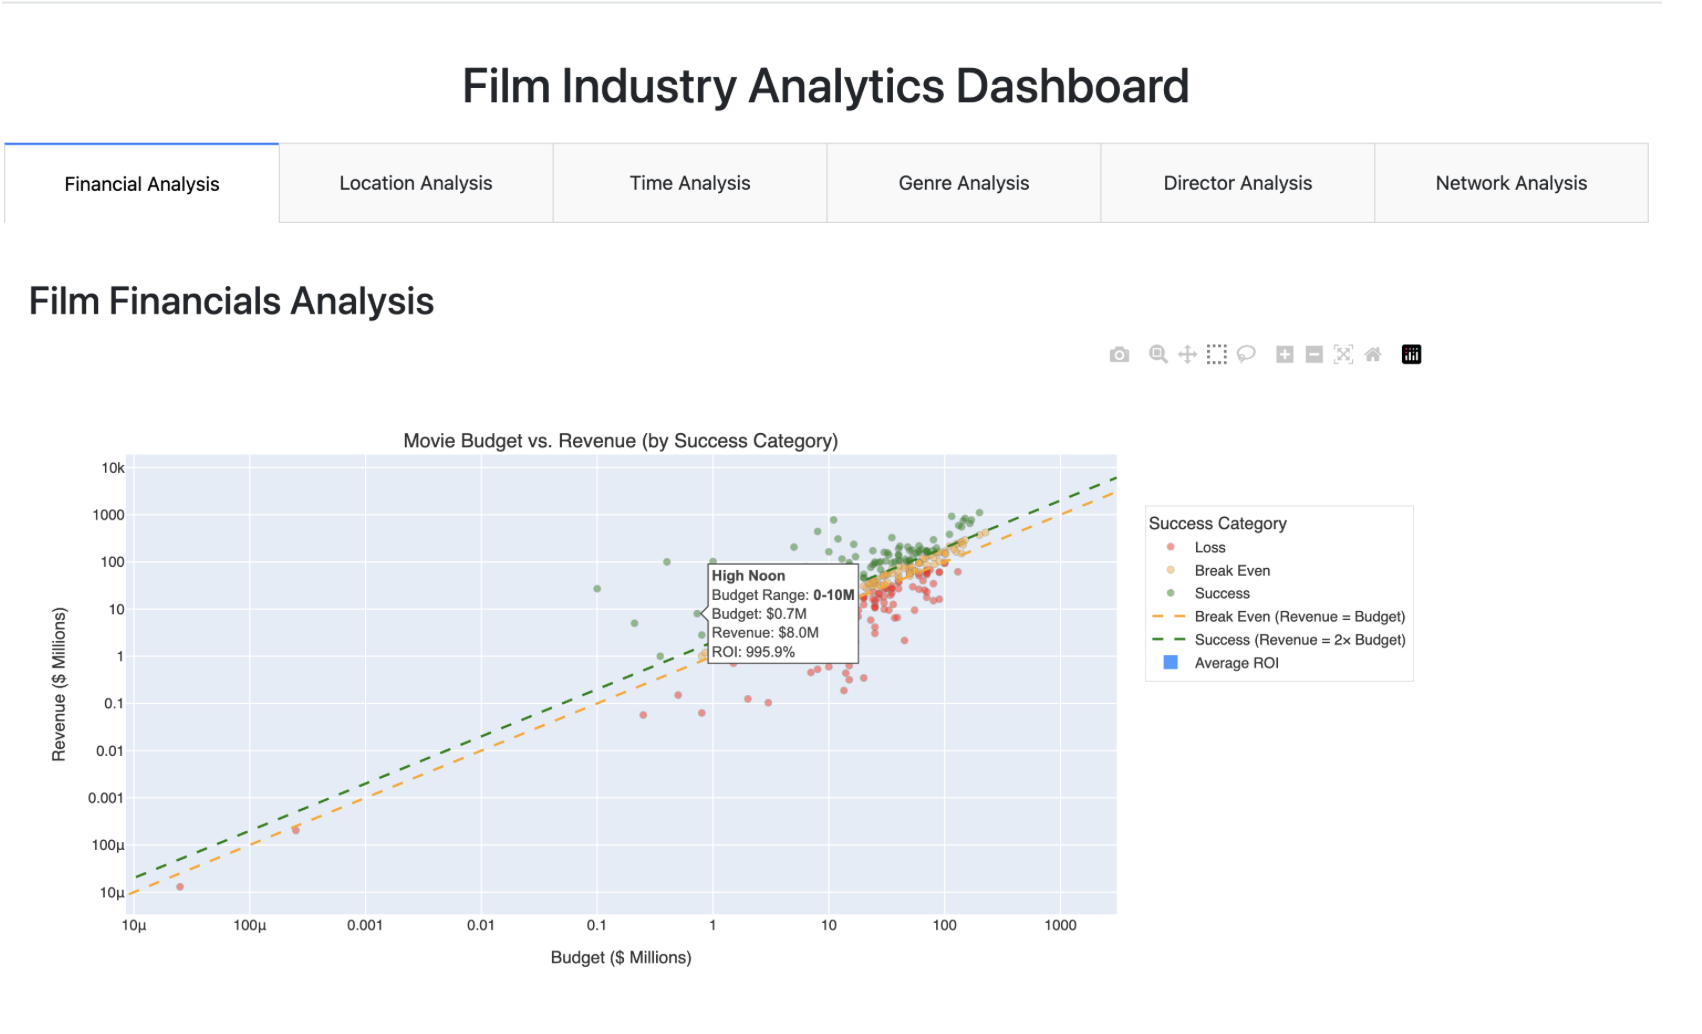
🎞️ Film Production Analytics Dashboard
An interactive web application that transforms complex film industry data into actionable insights through six analytical views: financial performance, global production distribution, release timing optimization, genre analytics, director metrics, and studio collaboration networks.
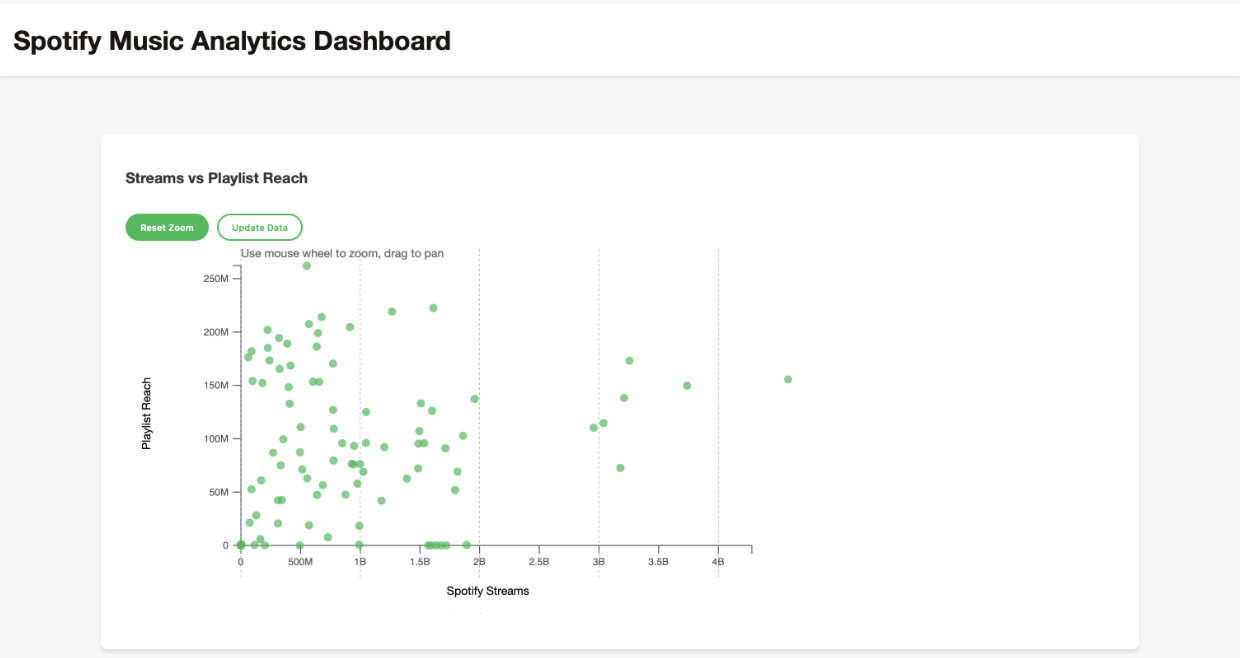
🎵 Spotify Music Analytics Dashboard
An interactive web-based dashboard that visualizes data from the Spotify 2024 dataset using D3.js. Features dynamic scatterplots with zoom and pan functionality, horizontal bar charts for top artists, and platform comparison visualizations across Spotify, YouTube, and TikTok with toggle options for different metrics.